Please wait while we prepare your visualisations. This may take a moment depending on the size of your dataset.
GazePlotter
Free eye-tracking data visualisation
Transform eye gaze data from eye trackers to interactive scarf plots. No registration, no ads and no data stored on a server. We love open science.
Processing data
Peer-reviewed in BRM
Vojtechovska, M., Popelka, S. GazePlotter: An open-source solution for the automatic generation of scarf plots from eye-tracking data. Behav Res 58, 85 (2026). doi:10.3758/s13428-026-02959-5
Go to articleWorks with Tobii, SMI & more
The app creates interactive sequence charts and other analysis from Tobii, SMI, GazePoint and other eye trackers. Just upload your data and see the results.
Which files to upload?Interactive scarf plots
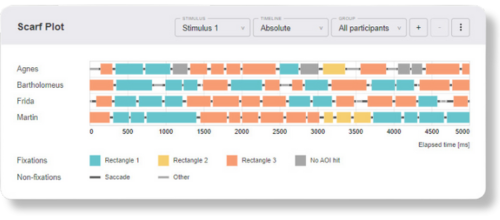
Scarf plots (sequence charts) are a great way to visualise eye-tracking data. They show the order of fixations in time and their hits on areas of interest (AOI). In GazePlotter, they are interactive, customisable and easy to share.
Runs without Internet
GazePlotter does not store your data on a server, thus ensuring data privacy. All is done in your browser. You can use it on PCs, Macs, tablets, even off-line!
How to download GazePlotter?Other eye tracking tools
Eye-Tracking Group at Department of Geoinformatics, Palacký University Olomouc, develops other eye tracking tools for free use.
More eye tracking tools