Transition Matrix
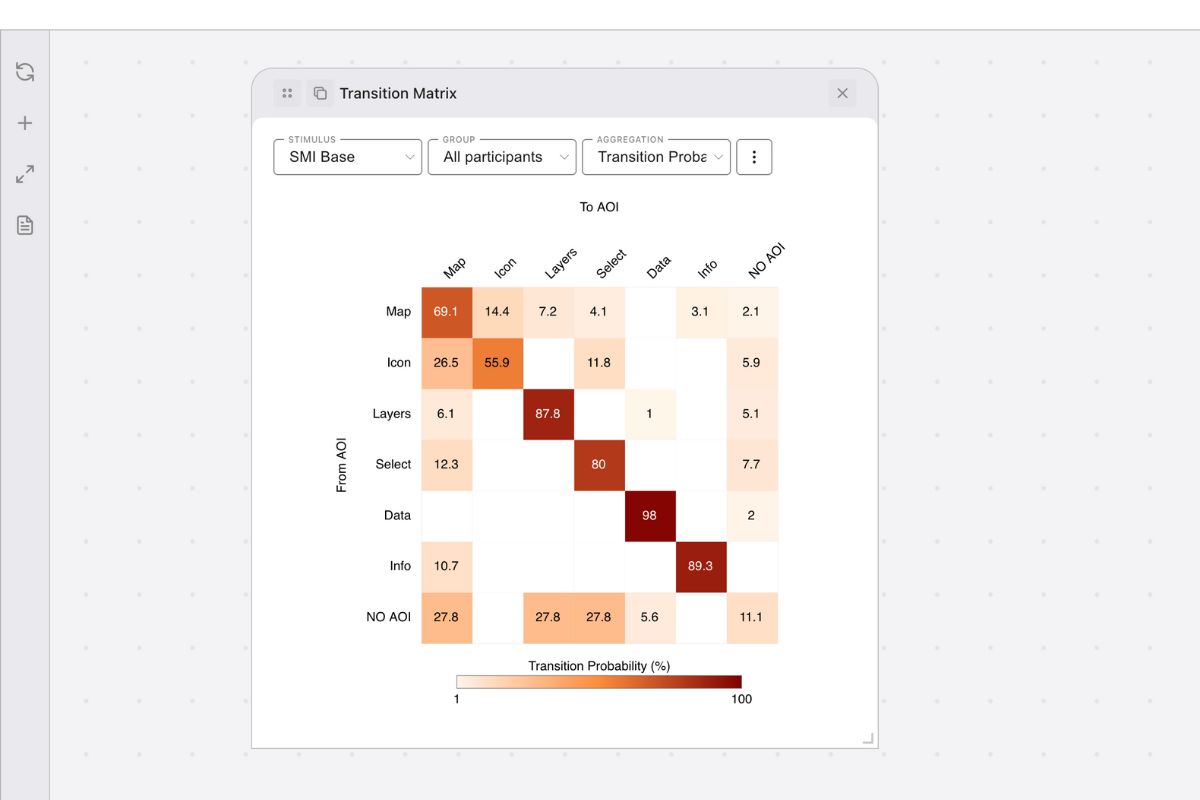
The Transition Matrix in GazePlotter provides a visual analysis of gaze transition patterns between Areas of Interest (AOIs). This heat map visualization shows how participants’ gaze moves from one AOI to another, revealing scanpath patterns and visual attention flow in eye-tracking research.
Interested on how to operate with plots in general within the workspace? See:
Metric Contract
To render a Transition Matrix, GazePlotter queries the workspace’s metric library. This visualization requires a metric configuration that satisfies the following contract:
- Output Shape:
aoi-pair-matrix(computes values for transitions between pairs of Areas of Interest, FROM one AOI TO another). - Windowing:
forbidden(calculated across the selected time range as a single aggregate).
Transitions & Markov Documentation: For details on transitions, Markov probability models (
P^k), and visit collapsing, see the Transitions & Markov Metrics documentation.
Configuration via Settings Pane
Clicking the Transition Matrix plot card in the workspace selects the plot and opens its configuration options in the sidebar Settings Pane (or bottom sheet on mobile). The settings are organized into the following collapsible sections:
Stimulus
Choose the stimulus to analyze. Each stimulus contains its own set of Areas of Interest (AOIs) which form the rows and columns of the matrix.
- Edit stimulus library…: Opens the Stimuli Modification modal to manage stimulus files and dimensions.
Participant group
Filter the eye-tracking data by group.
- Select group: A dropdown containing All participants and custom participant groups.
- Edit groups…: Opens the Participant Groups modal to create or modify comparative groups.
- Edit participants…: Opens the Participant Modification modal to customize participant properties and metadata.
Metric
Configure the quantitative transition metric displayed in the matrix cells.
- Select metric: A dropdown of all metric instances in the library that satisfy the
aoi-pair-matrixshape contract. Standard metrics include:- Transition count (fixation) (
transitionCount-fix): Raw number of transitions between AOI pairs based on individual fixations (see Transitions). - Transition count (visit) (
transitionCount-visit): Raw transitions based on distinct visits (consecutive fixations) (see Transitions). - 1-step probability (
transitionProbability-fix): Conditional probability of transitioning TO an AOI given you are coming FROM a specific AOI (see Transitions). - Mean dwell duration (fixation) (
transitionDwellMean-fix): Average fixation duration in the “FROM” AOI before a transition (see Transitions). - Mean dwell duration (visit) (
transitionDwellMean-visit): Average total duration of consecutive fixations in the “FROM” AOI before transitioning (see Transitions).
- Transition count (fixation) (
- Edit metric library…: Opens the Metric Library modal where you can customize transition calculation parameters or define custom transition/matrix metrics.
Visualisation
Configure cell scaling, colors, and outlier rendering.
- Color scale: Customizes cell shading mapping.
- Min: Set value mapped to the minimum color intensity.
- Max (0 = Auto): Set value mapped to the maximum color intensity or leave at 0 for automatic maximum scaling.
- Color Scale Picker: Interactive color picker to select the start, middle, and end colors for the matrix gradient.
- Out of bounds: Custom color settings for values that fall outside the defined scale range:
- Below min: Choose color (default is gray) and toggle Show text labels for cell values below minimum.
- Above max: Choose color (default is red/gray) and toggle Show text labels for cell values above maximum.
- Hide data: Check No AOI data to hide participants who have zero registered fixations/events across all AOIs.
Time range [ms]
Filter the temporal range from which transitions are calculated.
- Start: Limit the minimum time boundary (ms).
- End (0 = Auto): Limit the maximum time boundary (ms) or leave at 0 for automatic duration matching.
Areas of Interest
Filters which Areas of Interest (AOIs) are rendered as rows and columns in the matrix.
- Configure AOI Library…: Opens the AOI Modification modal to add, remove, rename, or color-code AOIs.
Export
Located at the bottom of the Settings Pane:
- Download plot…: Opens the export modal to download the plot.
- File formats: PNG (recommended, transparent background) or JPG (white background).
- Dimensions: Customizable width (height maintained as square to preserve matrix proportions).
- Quality: Adjustable DPI setting.
- Margins: Configurable margins.
- Preview: Live render of the output before saving.
Interpretation
Use the Transition Matrix to:
- Identify scanpath patterns: Discover common gaze movement sequences between specific AOIs.
- Compare transition frequencies: See which AOI pairs attract the most visual transitions.
- Analyze attention flow: Understand visual search hierarchies and navigation order.
- Detect visual hierarchies: Identify which AOIs serve as hubs (attracting and distributing attention).
Reading the Matrix
- Row patterns: Where gaze typically goes FROM each AOI (row category).
- Column patterns: Where gaze typically comes TO each AOI (column category).
- Diagonal values: Transitions within the same AOI (re-fixations/dwell consistency).
- Empty cells: Transitions that rarely or never occur.