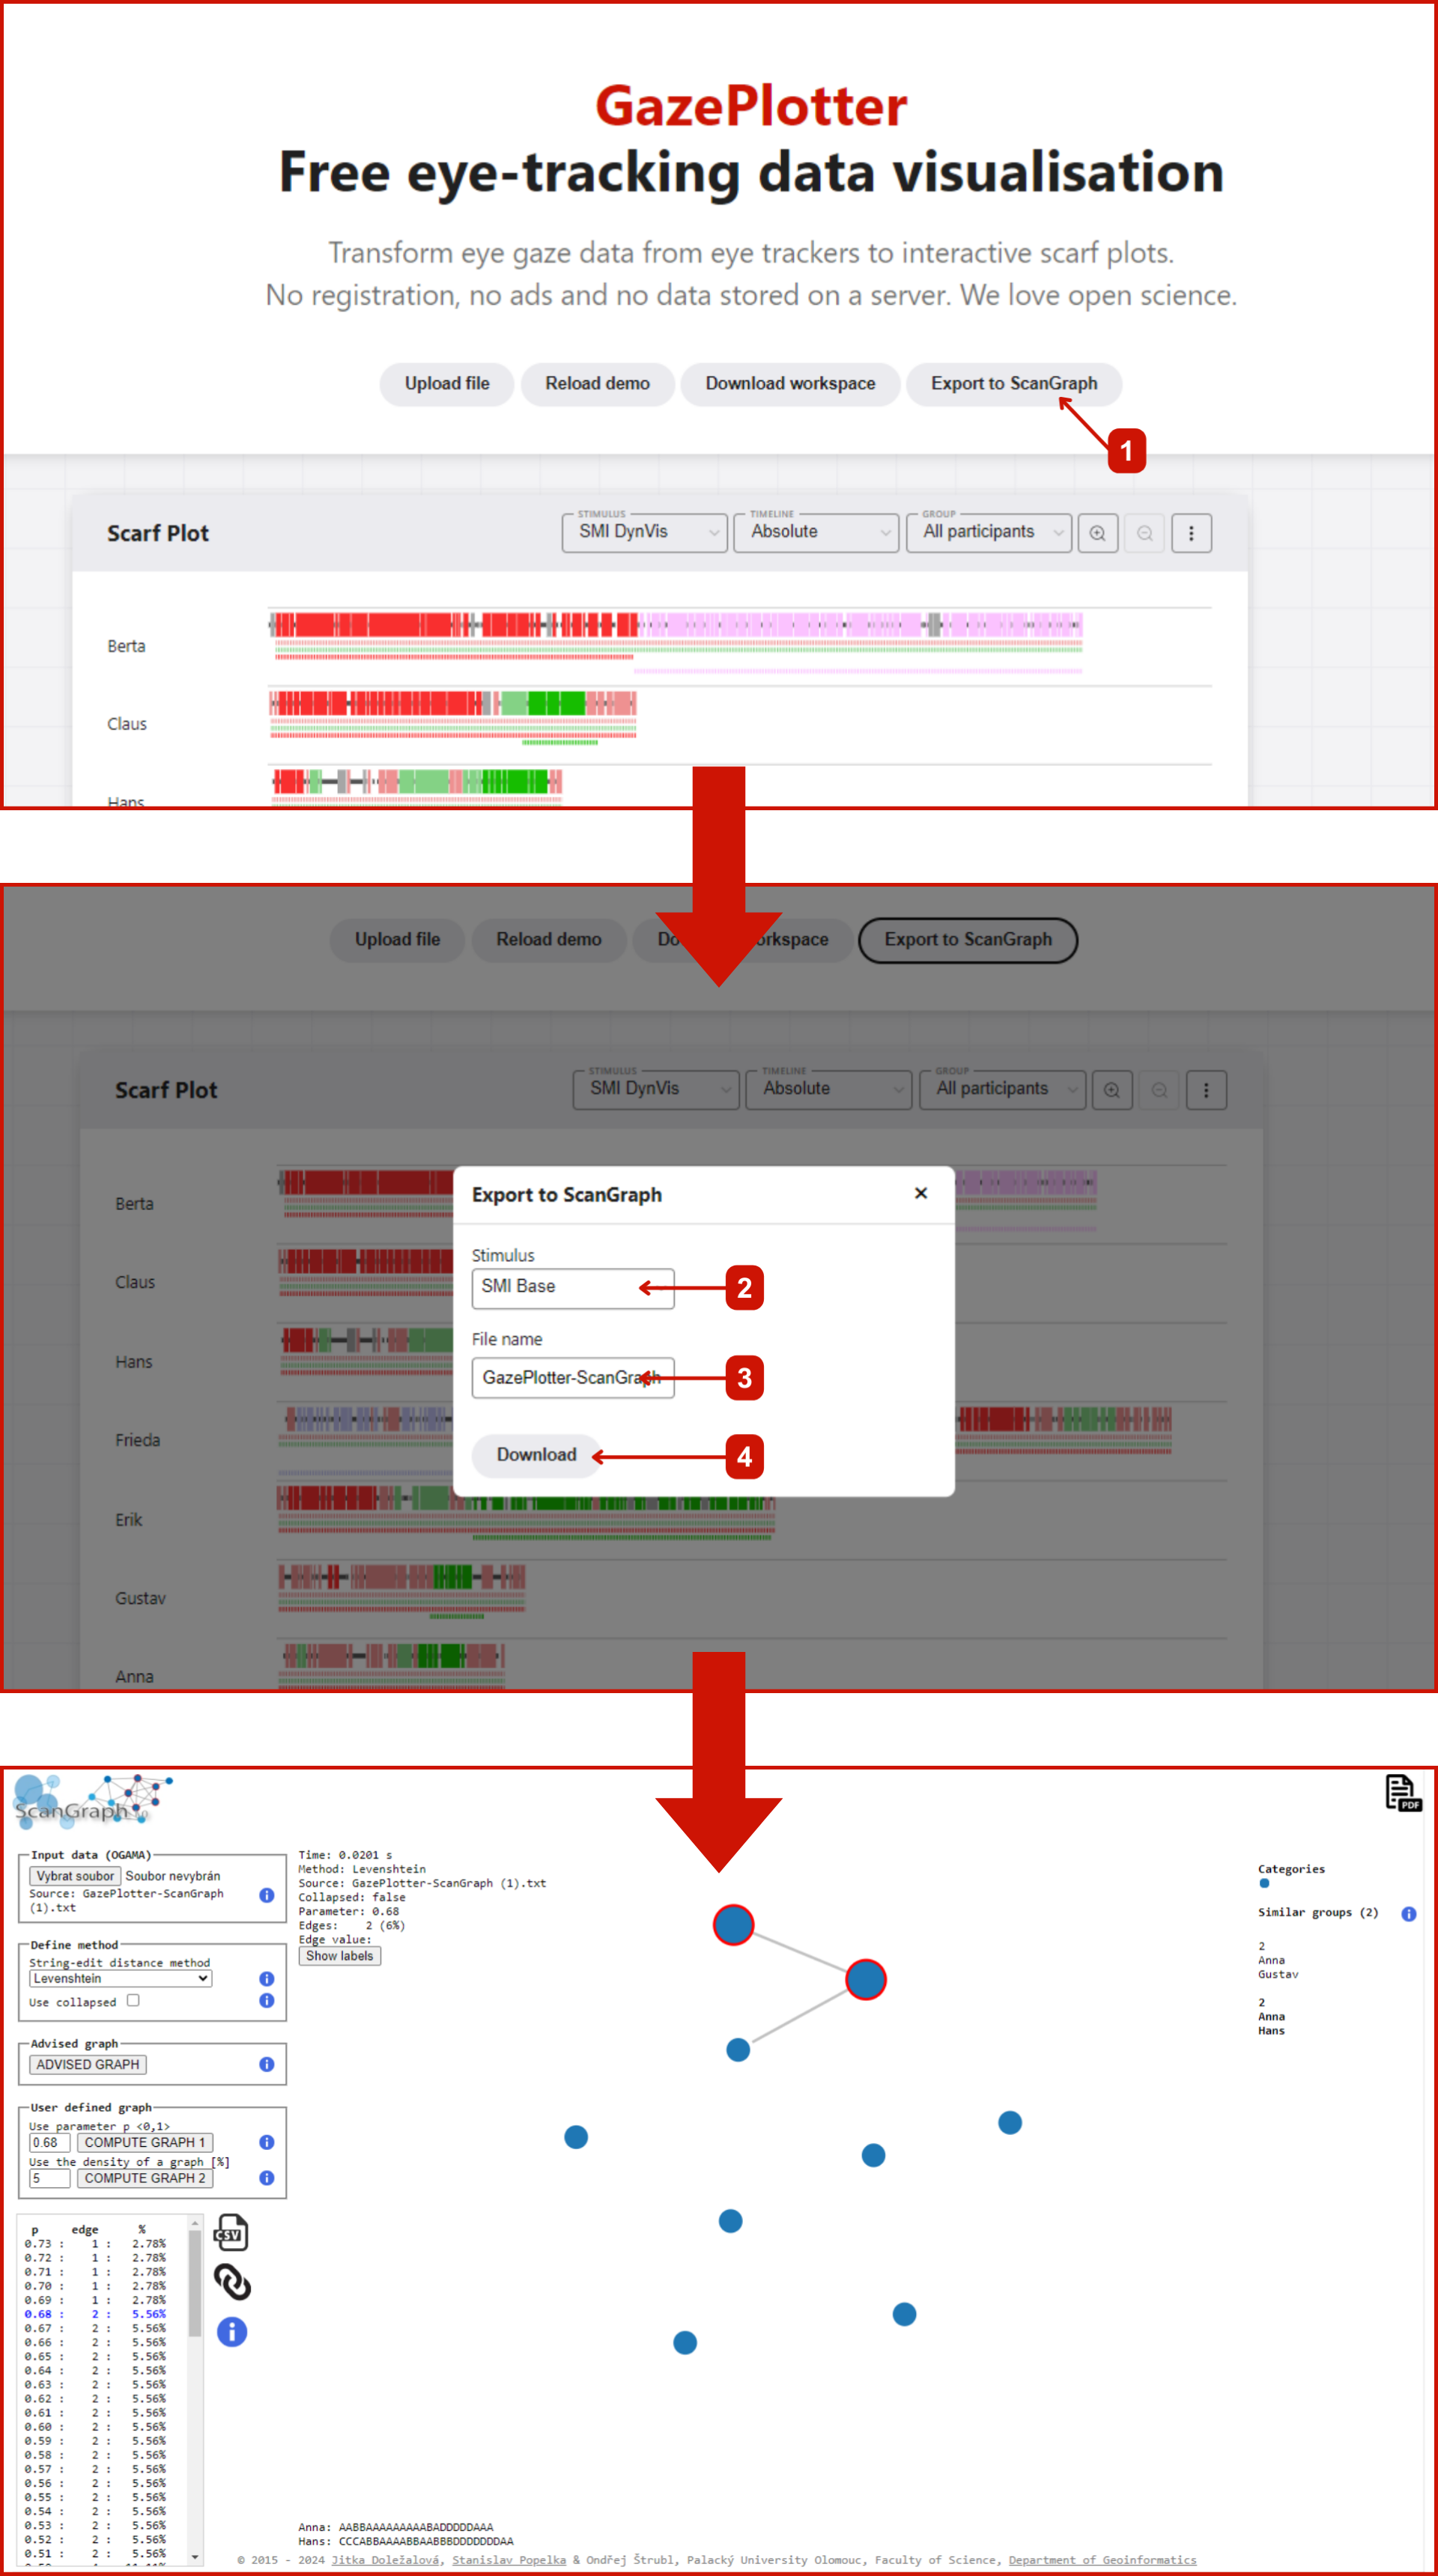
ScanGraph Export
ScanGraph Export writes fixation sequences as letter-coded strings in a .txt file for analysis in ScanGraph, the external scanpath-similarity tool of Doležalová and Popelka (2016, Journal of Eye Movement Research, 9(4), doi:10.16910/jemr.9.4.5).
ScanGraph-style network analysis is already built into GazePlotter: the Scanpath Similarity plot has a ScanGraph network view, powered by the Scanpath Similarity metrics. Use this export only if you want to run the standalone ScanGraph tool.
Output format
- Each AOI is assigned a letter; each participant’s fixations become a string of those letters.
- The strings come from the same encoder the Scanpath Similarity metrics use: only fixations are encoded, merged AOIs share one letter, and fixations outside every AOI become
#. The export always covers all AOIs, all participants, and the full recording. A plot narrowed by an AOI selection, participant selection, or time range analyses correspondingly narrowed strings. - The file header lists the legend (which letter maps to which AOI, and
#for no fixation), followed by one sequence per participant. - The file doubles as an OGAMA “Similarity Measurements” file, so it can be uploaded back into GazePlotter as ordinal scanpath data.
Exporting
- Click Export in the workspace Ribbon.
- Under Other options, click the ScanGraph Format card.
- Select the Stimulus.
- Choose the string form: Original keeps one letter per fixation (dwell duration weighs in); Collapsed folds consecutive fixations in the same AOI (order only).
- Click Export ScanGraph.
Using it in ScanGraph
- Open the ScanGraph web app.
- Upload the exported
.txtfile. - Run the analysis to generate similarity networks and visualizations.