Workspace & Setup Overview
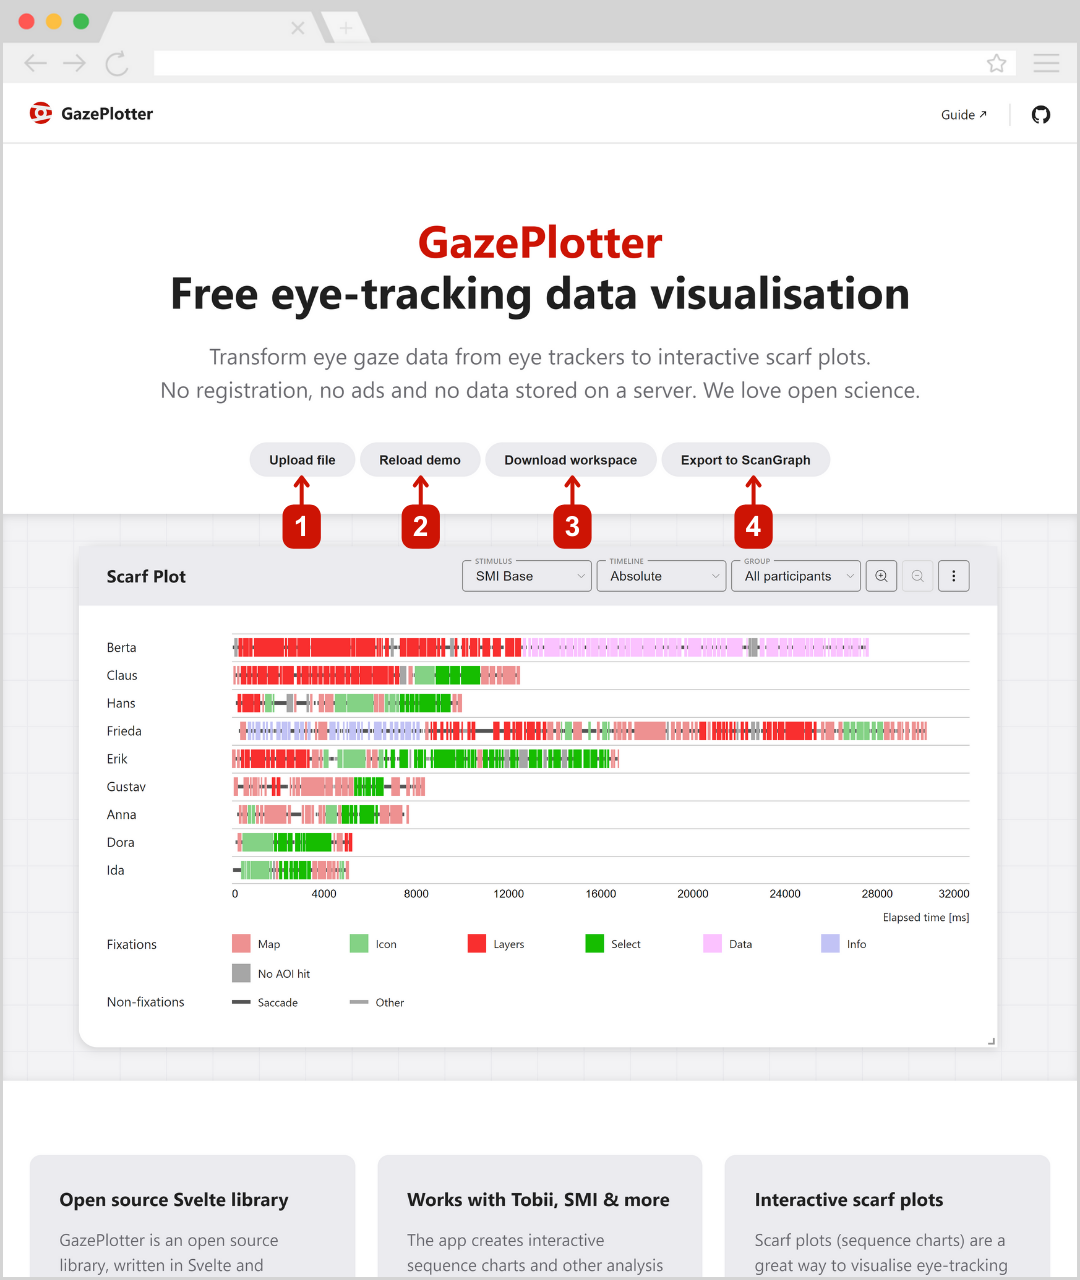
GazePlotter is a free web application for analyzing eye-tracking data. Simply visit gazeplotter.com to start analyzing your data immediately. No registration or installation required.
Quick Start
Step 1: Open GazePlotter
- Go to gazeplotter.com
- You’ll see a demo visualization with sample data
Step 2: Upload Your Data
- Click “Import” in the top bar
- Select your eye-tracking data file
- GazePlotter automatically detects the file type and creates visualizations
Step 3: Explore Your Data
- Use the controls in each plot to switch between participants, stimuli, and time views
- Click and drag plots to move them around
- Use the workspace toolbar to add more visualizations
Step 4: Save Your Work
- Click “Export” to save your analysis
- Choose “Workspace” to save everything for later or sharing with colleagues
Main Workspace Controls
The top bar of the workspace holds three controls:
- Import - Upload eye-tracking data or a saved workspace (file type is detected automatically)
- Export - Save your workspace or export data for other tools
- Metadata - View source and parsing details for the loaded data
Understanding the Interface
When you first open GazePlotter, you’ll see a scarf plot (timeline visualization) showing sample data. This demo includes:
- 2 stimuli (different images or screens participants looked at)
- 6 AOIs (Areas of Interest - specific regions in the images)
- 9 participants (people whose eye movements were recorded)
- 3 participant groups (organized for comparison)
Visualizations
To help you analyze eye-tracking data, GazePlotter provides a set of visualization plots, including Scarf Plot, AOI Comparison, Transition Matrix, AOI Timeline, and Recurrence Plot.
For detailed information about each visualization type and how to interpret them, see the Visualizations section.
Customizing Your Analysis
You can personalize how your data appears and is organized:
- AOI Library - Change colors, names, and order of areas of interest
- Stimuli Library - Rename and organize your images/screens
- Participant Groups - Create groups to compare different types of participants
- Participant Library - Rename participants for easier identification
What You Can Do
Basic Operations:
- Upload data from any major eye-tracking software
- View data in several different visualization types
- Move and resize plots by dragging
- Add multiple plots to compare different views
- Save your work to continue later or share with others
Advanced Features:
- Customize colors and names of areas of interest
- Group participants for comparative analysis
- Export data for use in other analysis tools
- Create multiple workspaces for different projects
Export Options
For exporting data and workspaces, see the dedicated Export section which covers workspace export, segmented data export, and ScanGraph integration.