Scarf plot
Scarf plot (or sequential graph) is a visualization of eye movement data that shows the sequence of fixations and saccades in time. It is a useful tool for analyzing the order of fixations and saccades, and for comparing the scanpaths of different participants or stimuli. Specific areas of interest (AOIs) in the given stimuli are color-coded and displayed in the scarf plot. The scarf plot is the main visualization tool in GazePlotter, and it is used to visualize eye-tracking data from various eye-tracking software.
Interested on how to operate with plots in general within the workspace? See:
Overview
The Scarf plot visualization provides a comprehensive chronological view of individual gaze events across groups. It allows for detailed sequential analysis of how individuals visually process stimuli over time.
Basic Controls
In GazePlotter, scarf plots have the following main controls:
- Stimulus - a drop-down menu for selecting the stimulus to be analyzed.
- Group - a drop-down menu for selecting the participant group.
- View - a drop-down menu for selecting the data representation or aggregation method.
- More options (⋮) - a button for accessing additional customization and export options.
Note: Zooming controls and a reset view button are also available directly on the header to temporally navigate your scarf plot quickly.
Stimulus
Choose which stimulus to analyze. Each stimulus contains its own set of AOIs that will be displayed in the scarf plot.
Group
Select participant groups:
- All participants - includes data from all participants
- Custom groups - analyze specific participant groups created in the grouping interface. See Participant Groups.
View
The View dropdown determines what timeline representation is calculated and displayed. Clicking on a view option opens a settings dialog with customizable parameters for the plot.
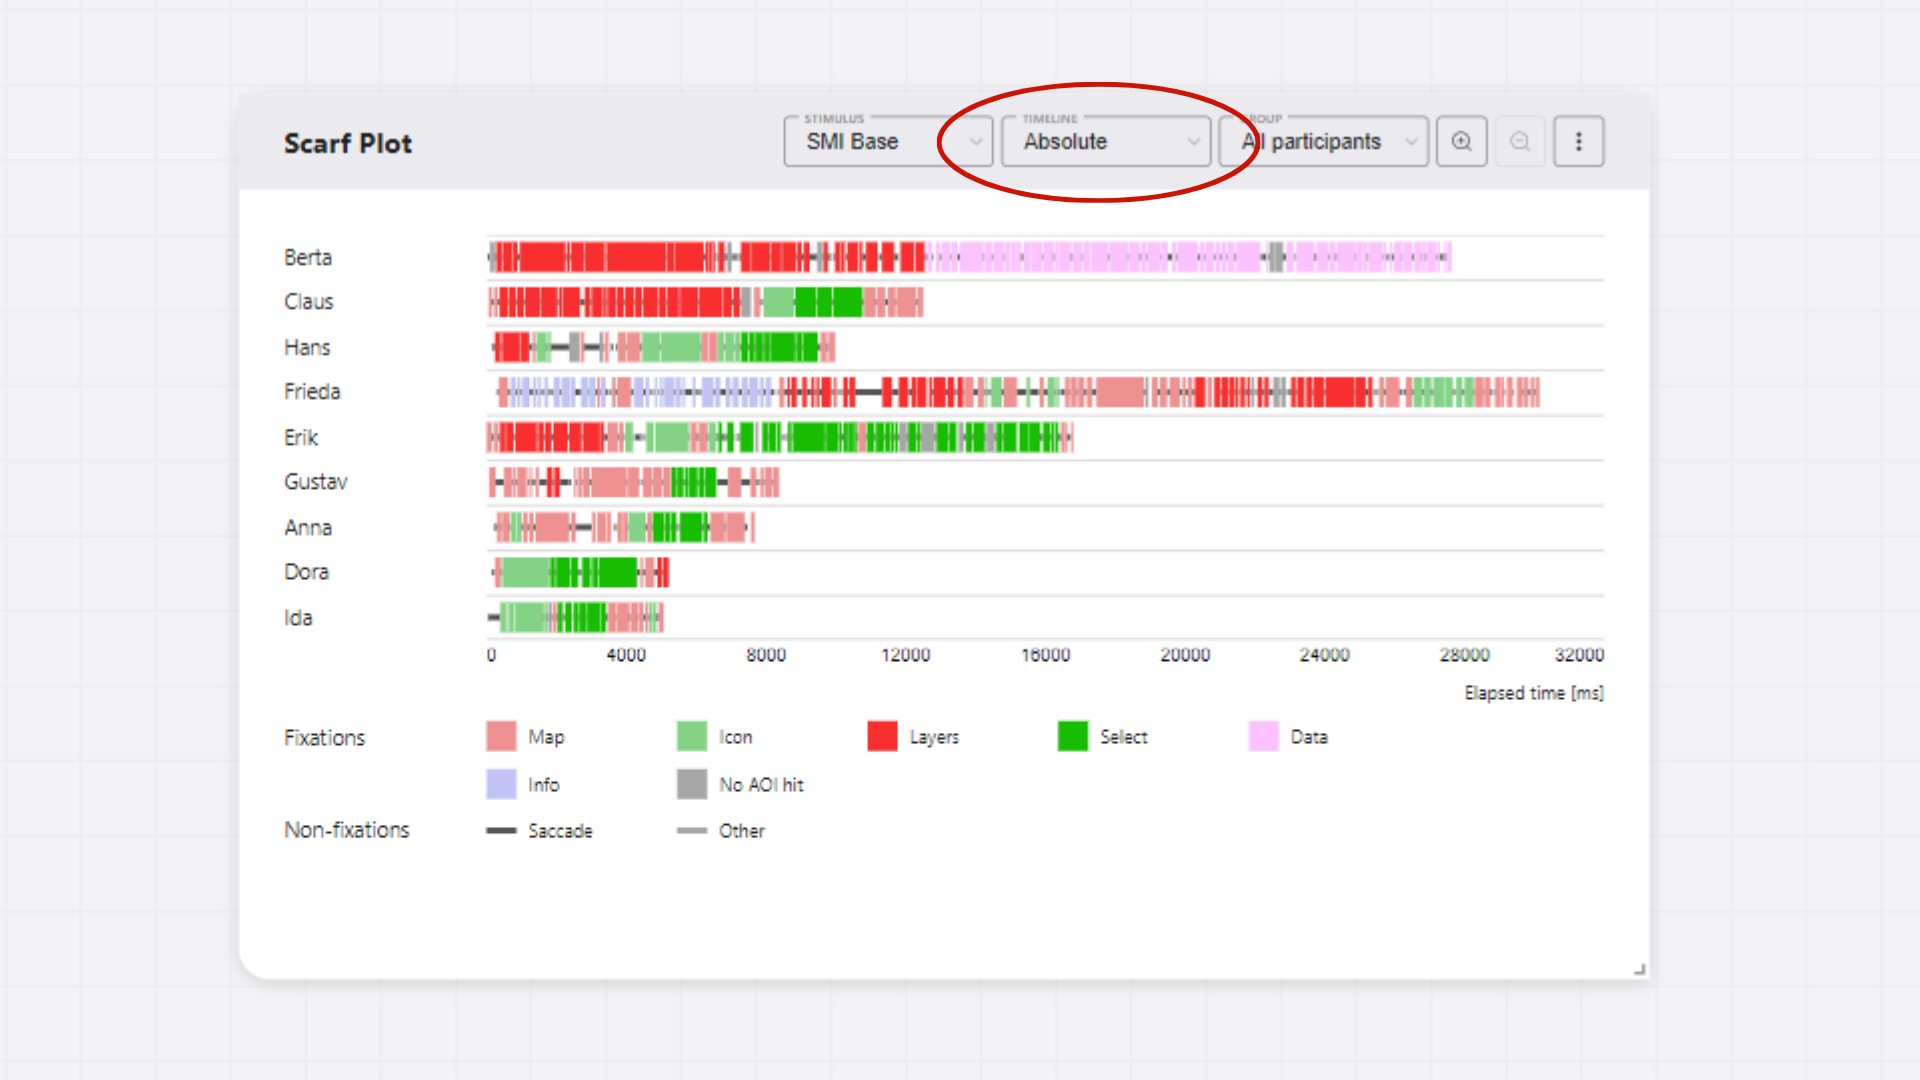
Absolute time
Displays fixations and events plotted in their exact chronological timing (in milliseconds).
| Parameter | Description |
|---|---|
| Time Range [ms] | Limit the temporal bounds displayed in the plot (Start / End, where 0 = Auto) |
| Hide non-fixations | Toggle visibility of saccades, blinks, and other non-fixation events to declutter the sequence |
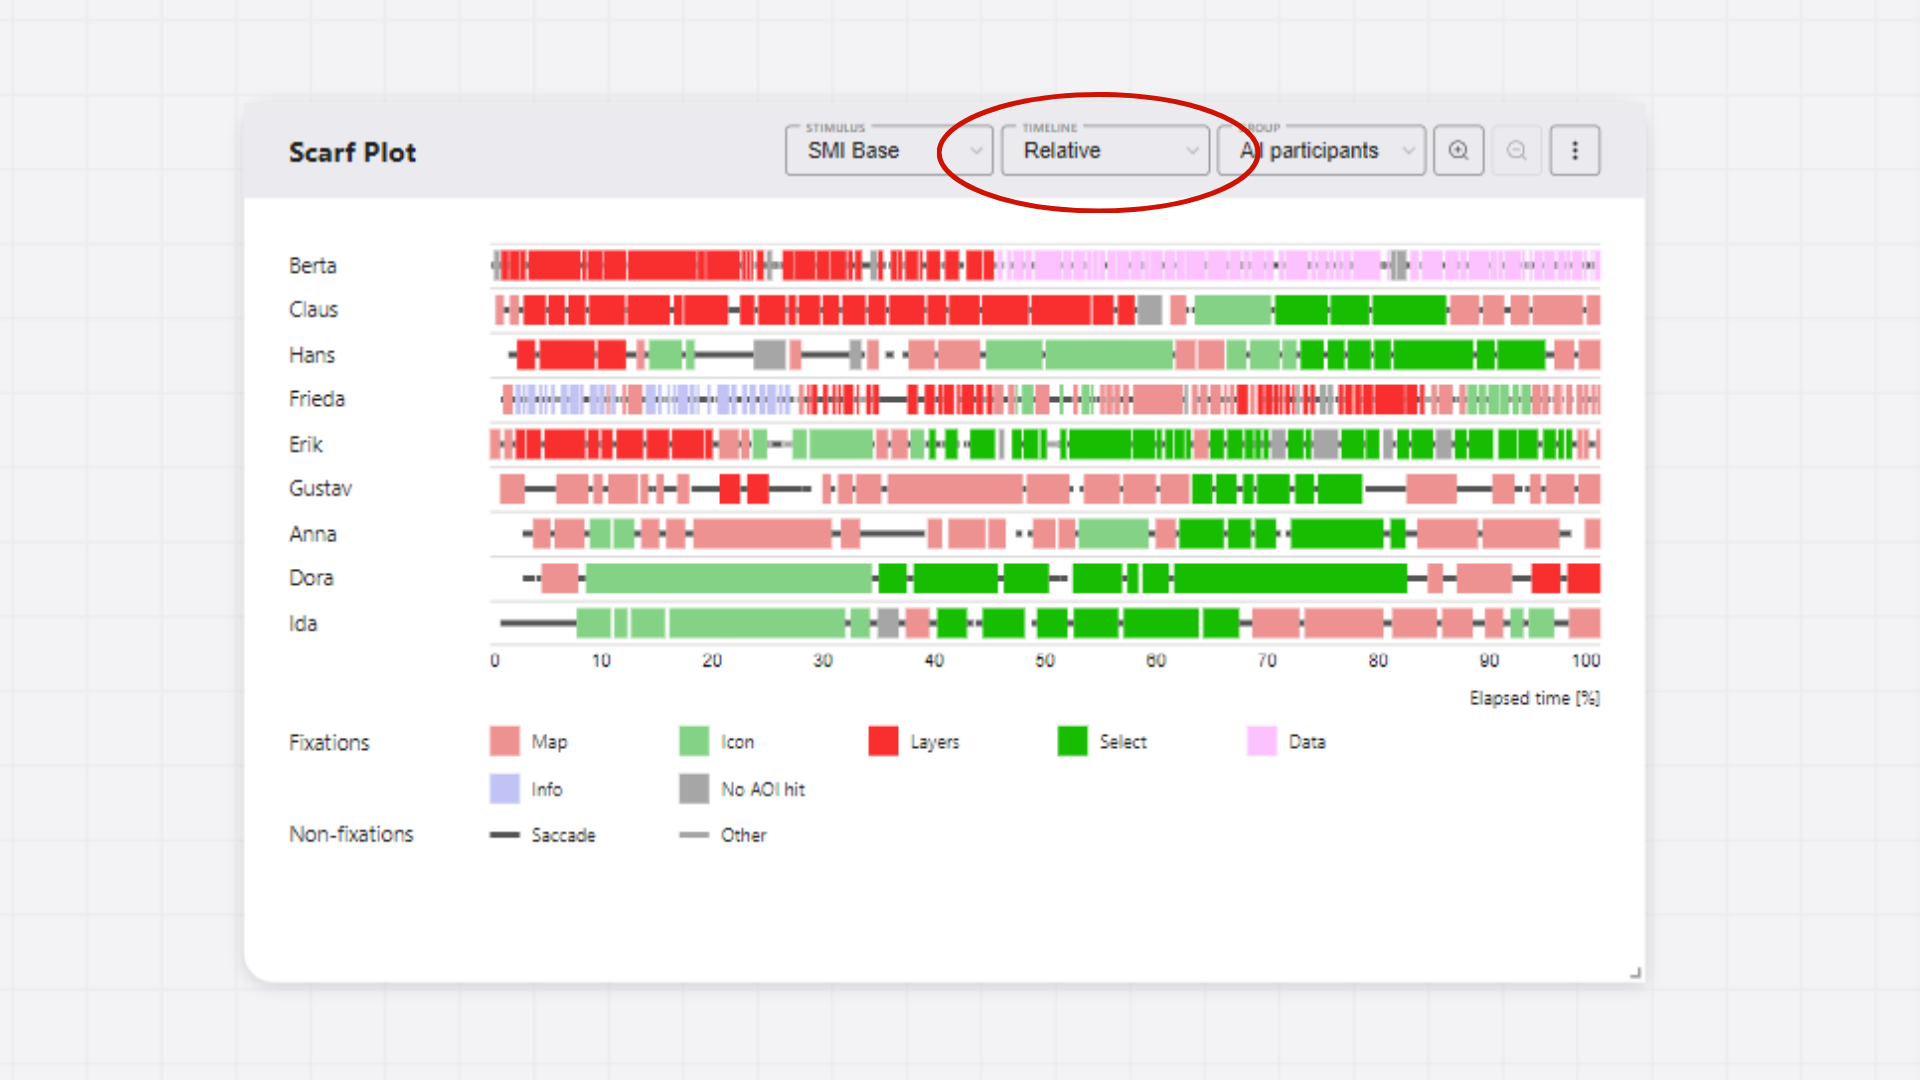
Relative time
Displays sequences proportional to the duration of the participant with the longest dwell time for comparability.
| Parameter | Description |
|---|---|
| Calculated from Time Range [ms] | Limit the temporal range based on absolute time from which relative percentages are formed |
| Hide non-fixations | Toggle visibility of saccades, blinks, and other non-fixation events to declutter the sequence |
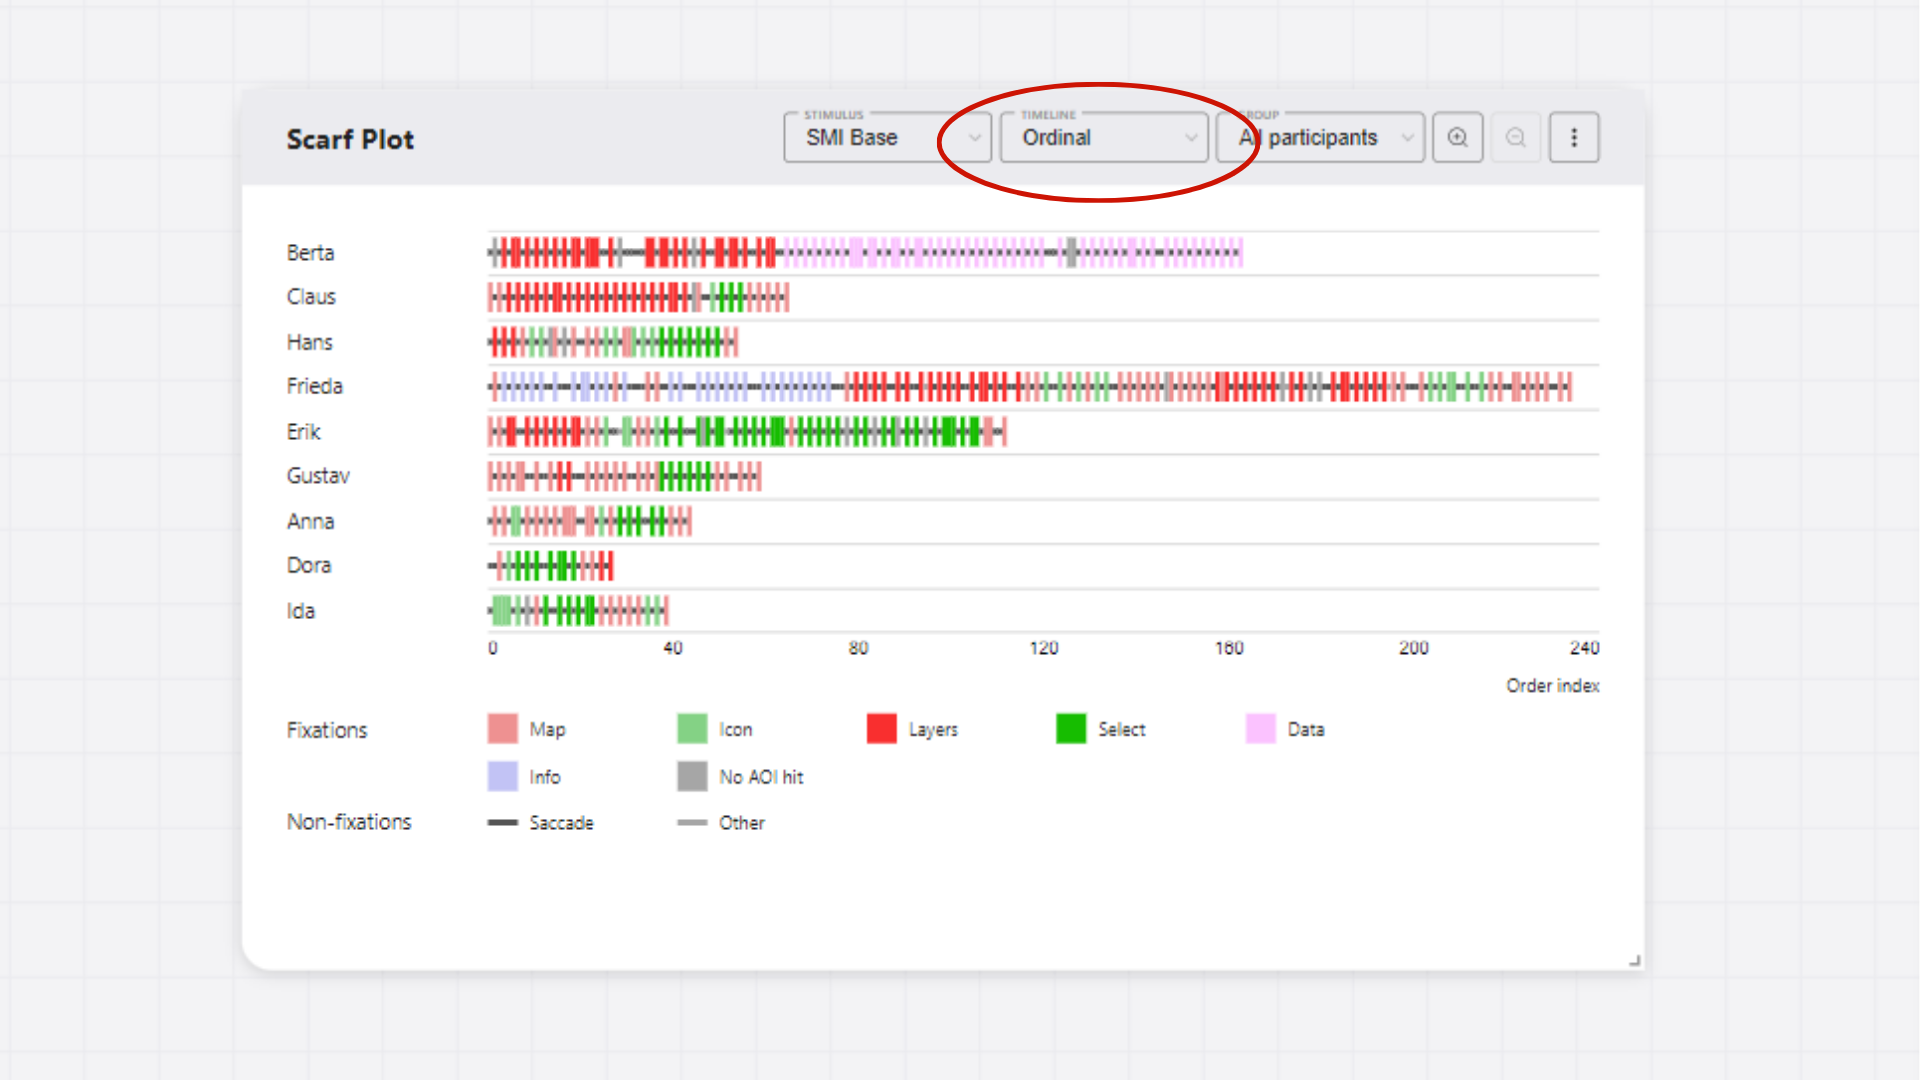
Ordinal time
Displays strict sequential order indices of individual fixations, saccades, and other events, discarding exact durations.
| Parameter | Description |
|---|---|
| Ordinal Range [indices] | Limit the indices sequence displayed in the plot (Start / End, where 0 = Auto) |
| Hide non-fixations | Toggle visibility of saccades, blinks, and other non-fixation events to declutter the sequence |
Warning: Some data, e.g. from OGAMA software, support only ordinal time representation.
More options
The scarf plot menu (⋮) provides quick access to customization and specific features:
Customization Options
- AOI customization - Modify colors, names, and order of Areas of Interest. See AOI Customization for details.
- Stimulus customization - Manage stimulus properties and settings. See Stimuli Customization for details.
- Participant customization - Customize individual participant properties and metadata. See Participants Customization for details.
- Setup participants groups - Create and modify participant groups for comparative analysis. See Participant Groups for details.
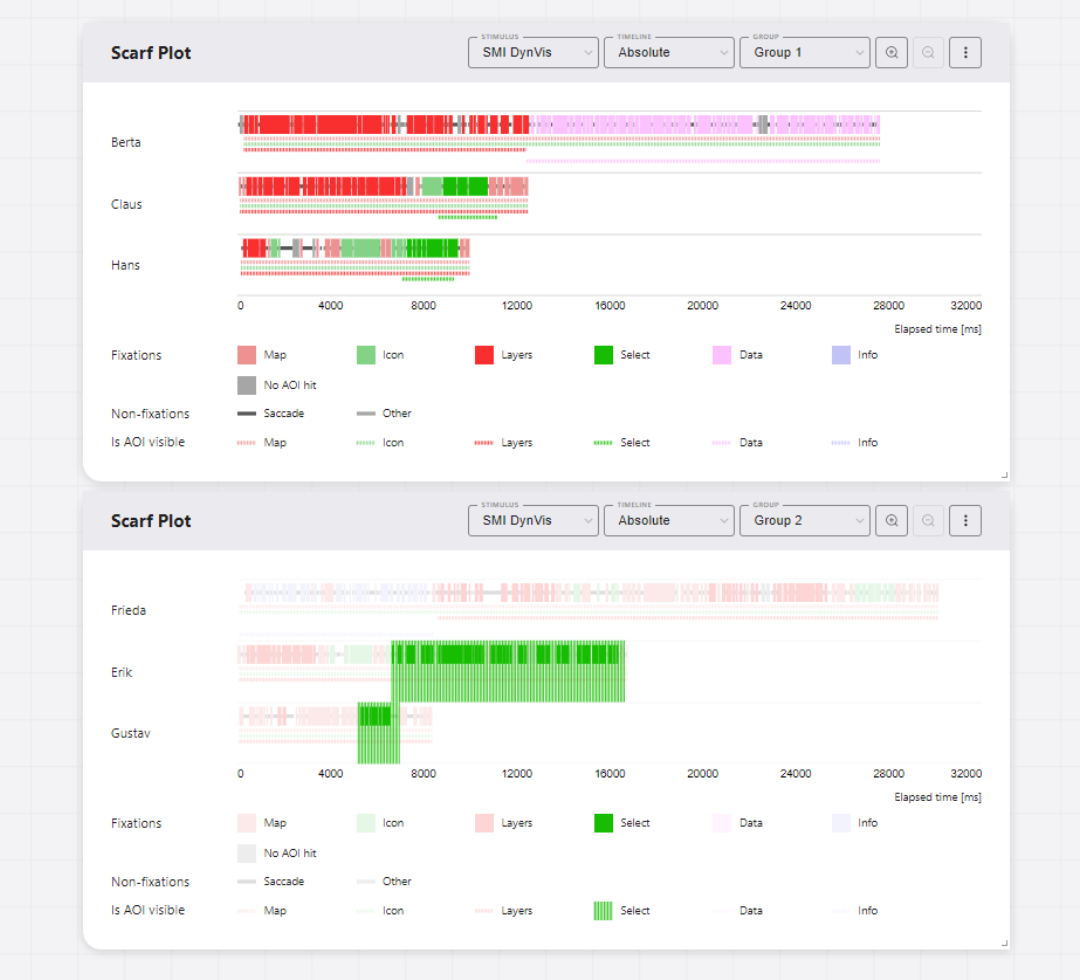
Adding AOI visibility data
Add dynamic AOI visibility data to enhance visualization. See below for details on how to generate and add this data.
Download plot
Export the scarf plot as an image file with customizable settings:
- File formats: PNG (recommended, transparent background) or JPG (white background)
- Dimensions: Customizable width (height calculated automatically based on content)
- Quality: Adjustable DPI setting for screen (96 DPI) or print (300 DPI) use
- Margins: Configurable top, right, bottom, left margins (negative values crop the image)
- Preview: Live preview of your exported plot before downloading
Export Data
Export processed eye-tracking data for external analysis.
This provides access to the raw fixation sequences, timing data, and AOI mappings in CSV format for analysis in R, Python, SPSS, or other statistical software. For detailed information about data export options and formats, see Segmented Data Export.
Interactivity
The scarf plot is interactive. Except for the basic controls and dragging the scarf plot around the workspace, you can interact with the scarf plot to get more detailed information about fixations, saccades, and AOIs in the data or highlight specific segments of the data.
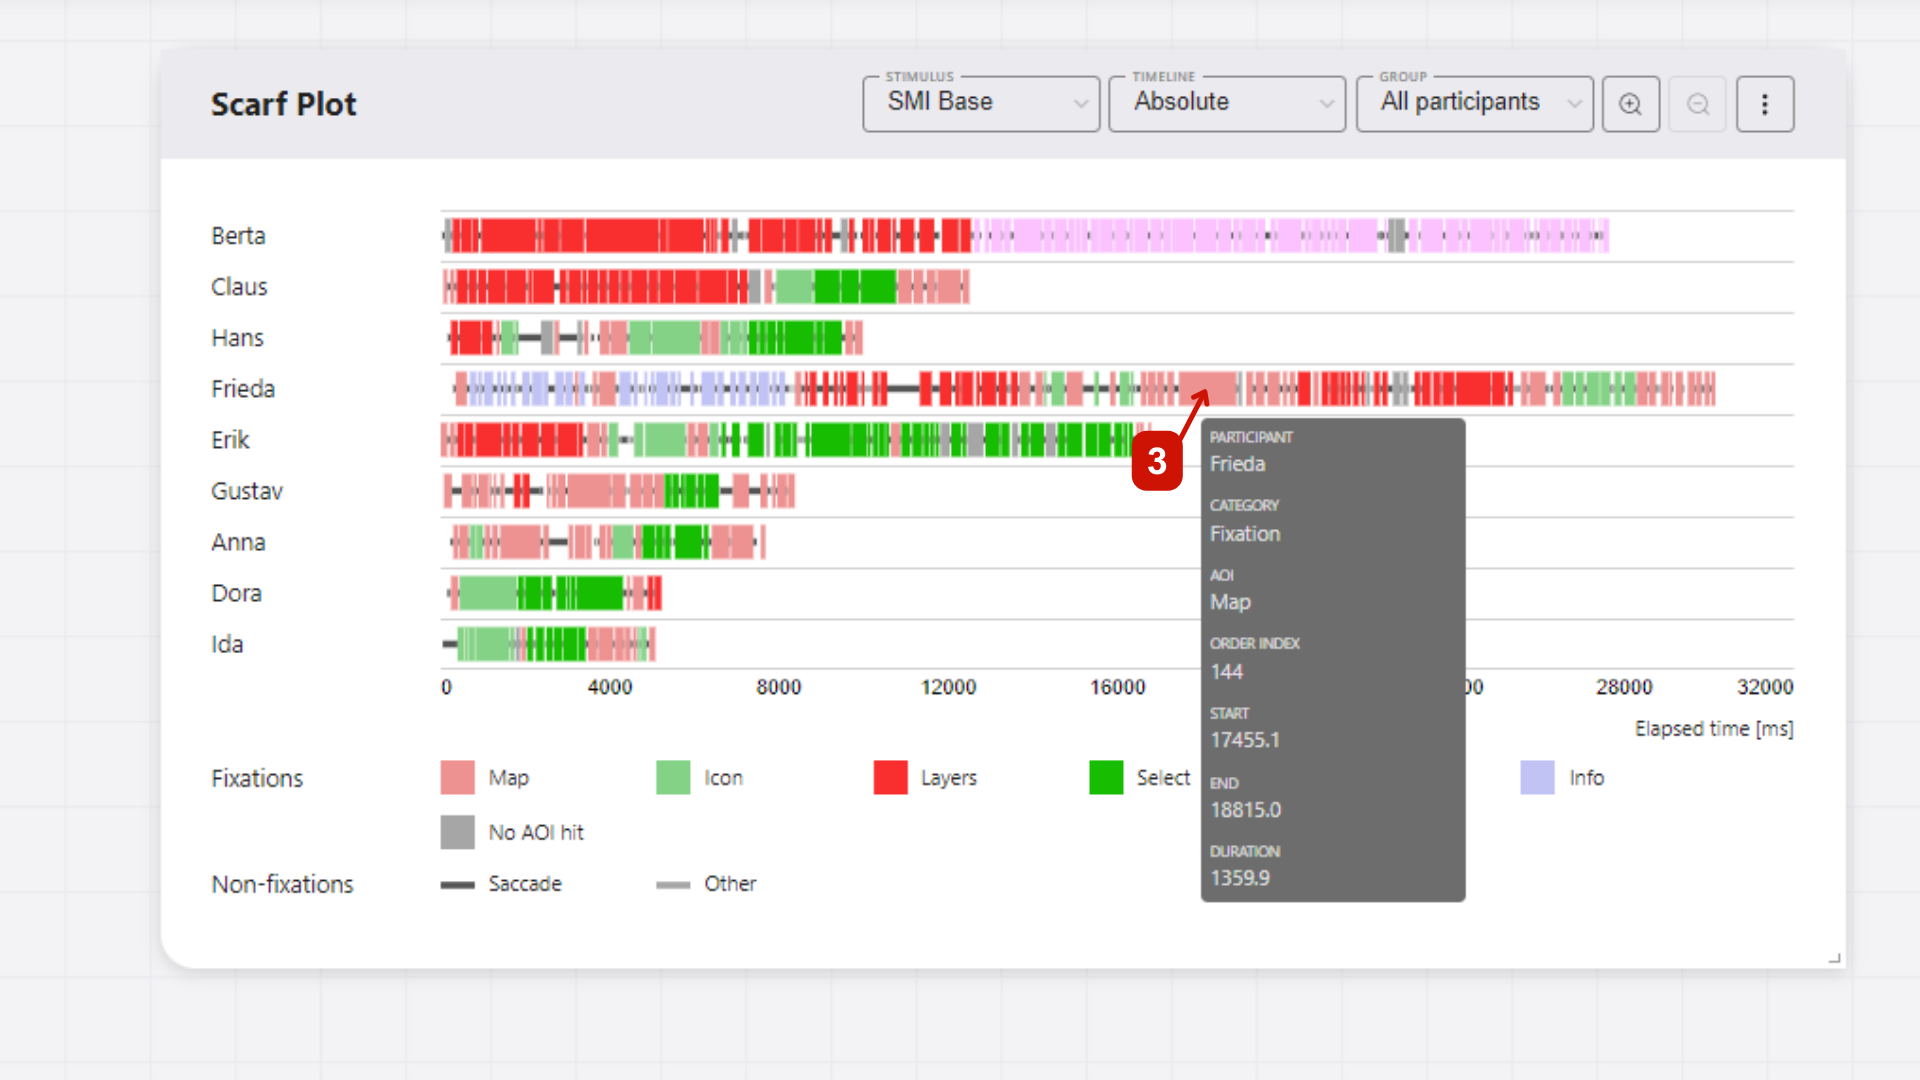
Sequence details
You can hover over fixations, saccades, and AOIs to see additional information, such as duration, start and end times, and AOI name. This information is displayed in a tooltip when you hover over the corresponding segment.
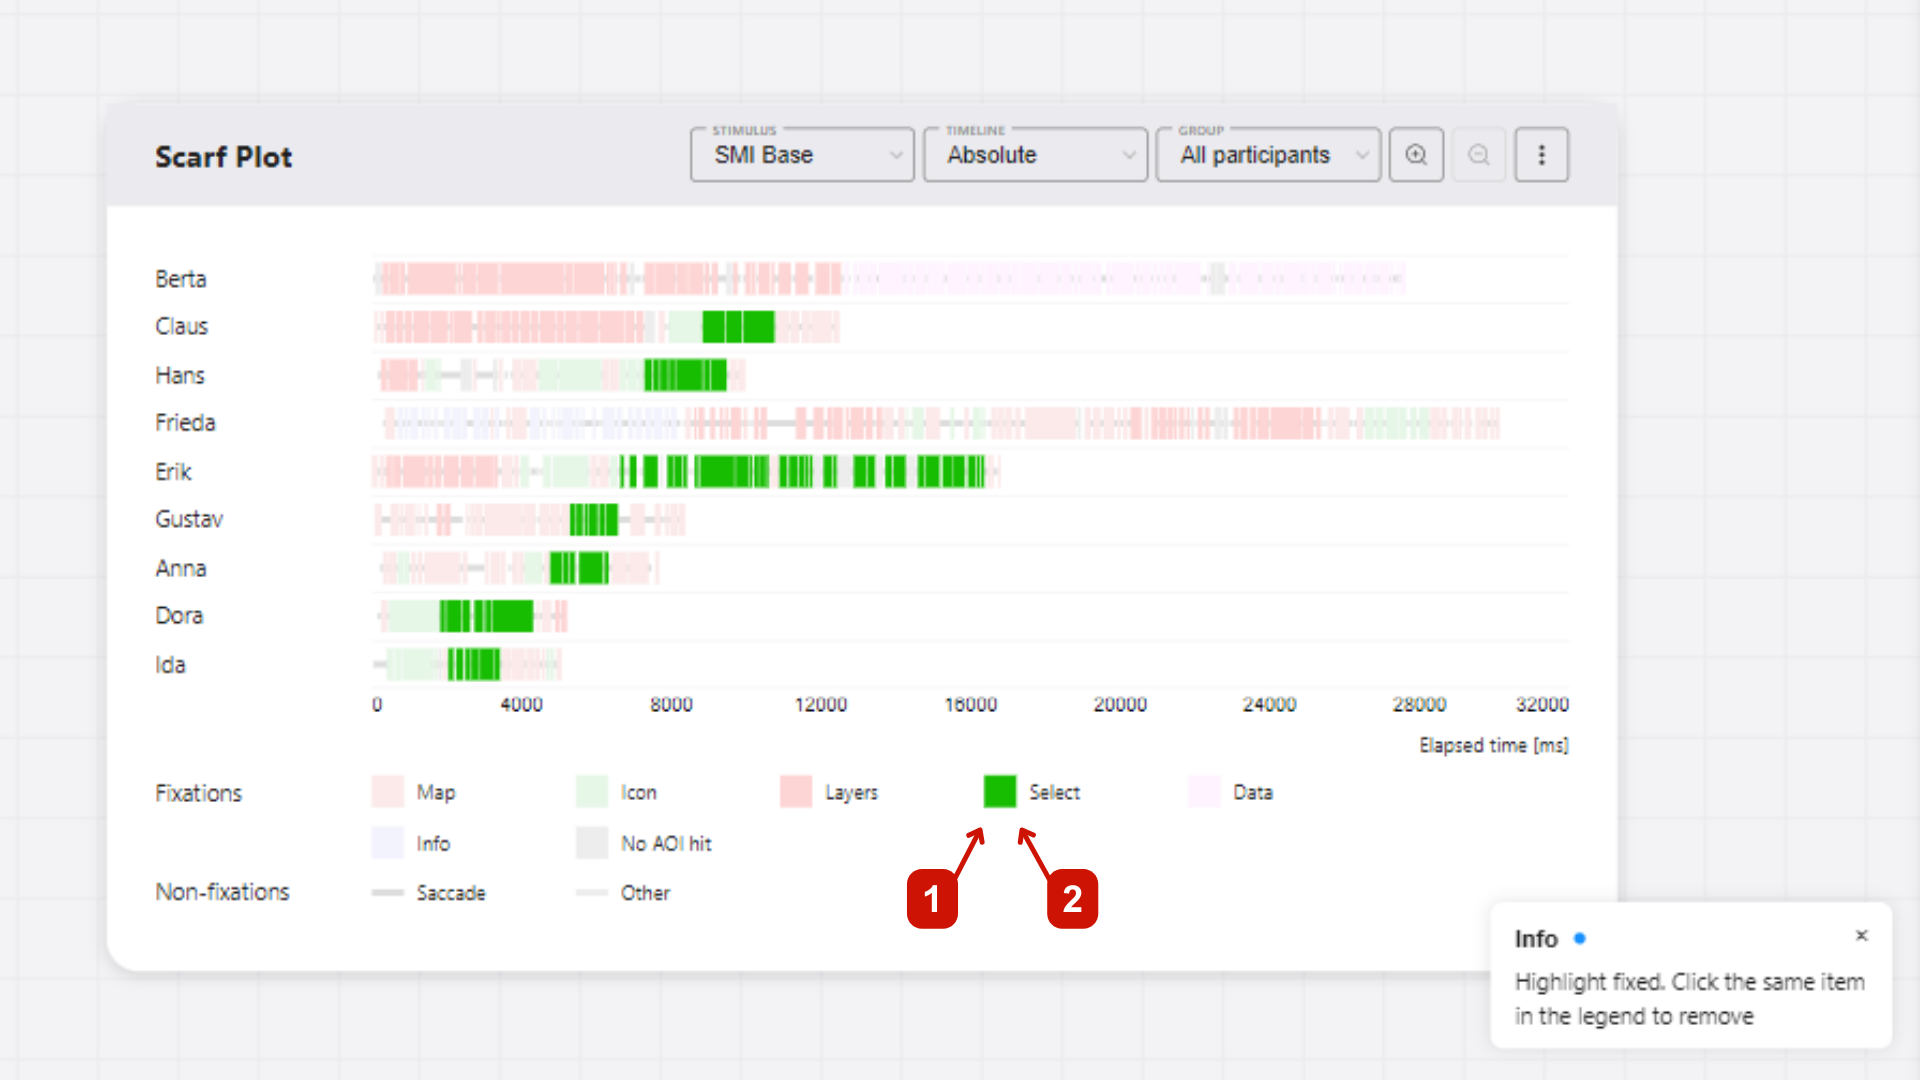
Highlighting
In the legend, you can highlight all segments of a specific category (fixations, saccades, or AOIs) by:
- Hovering over the category name in the legend to highlight all segments of that category temporarily.
- Clicking on the category name in the legend to highlight all segments of that category until you click on it again to remove the highlight.
Adding AOI visibility data
GazePlotter supports the upload of AOI visibility data, allowing for the effective visualization of dynamic AOIs and their visibility in the stimulus. This enhances interpretability of your eye-tracking data and allows for more detailed analysis.
Getting AOI visibility data
Warning: This feature is available only for SMI BeGaze and Tobii Pro Lab data.
From SMI BeGaze
In the SMI BeGaze software, open AOI Editor. Export the AOI visibility data as .xml file by clicking Save button. In this file, you can find the information about the visibility of each AOI in a given stimulus.
The exported file can be then simply added to the workspace to already uploaded SMI BeGaze data, see below.
From Tobii Pro Lab
In the Tobii Pro Lab software, open AOI tab. Export the AOI visibility data as .xml file by clicking Export button. In this file, you can find the information about the visibility of each AOI in a given stimulus.
The exported file can be then simply added to the workspace to already uploaded Tobii Pro Lab data, see below.
Adding AOI visibility data to the workspace
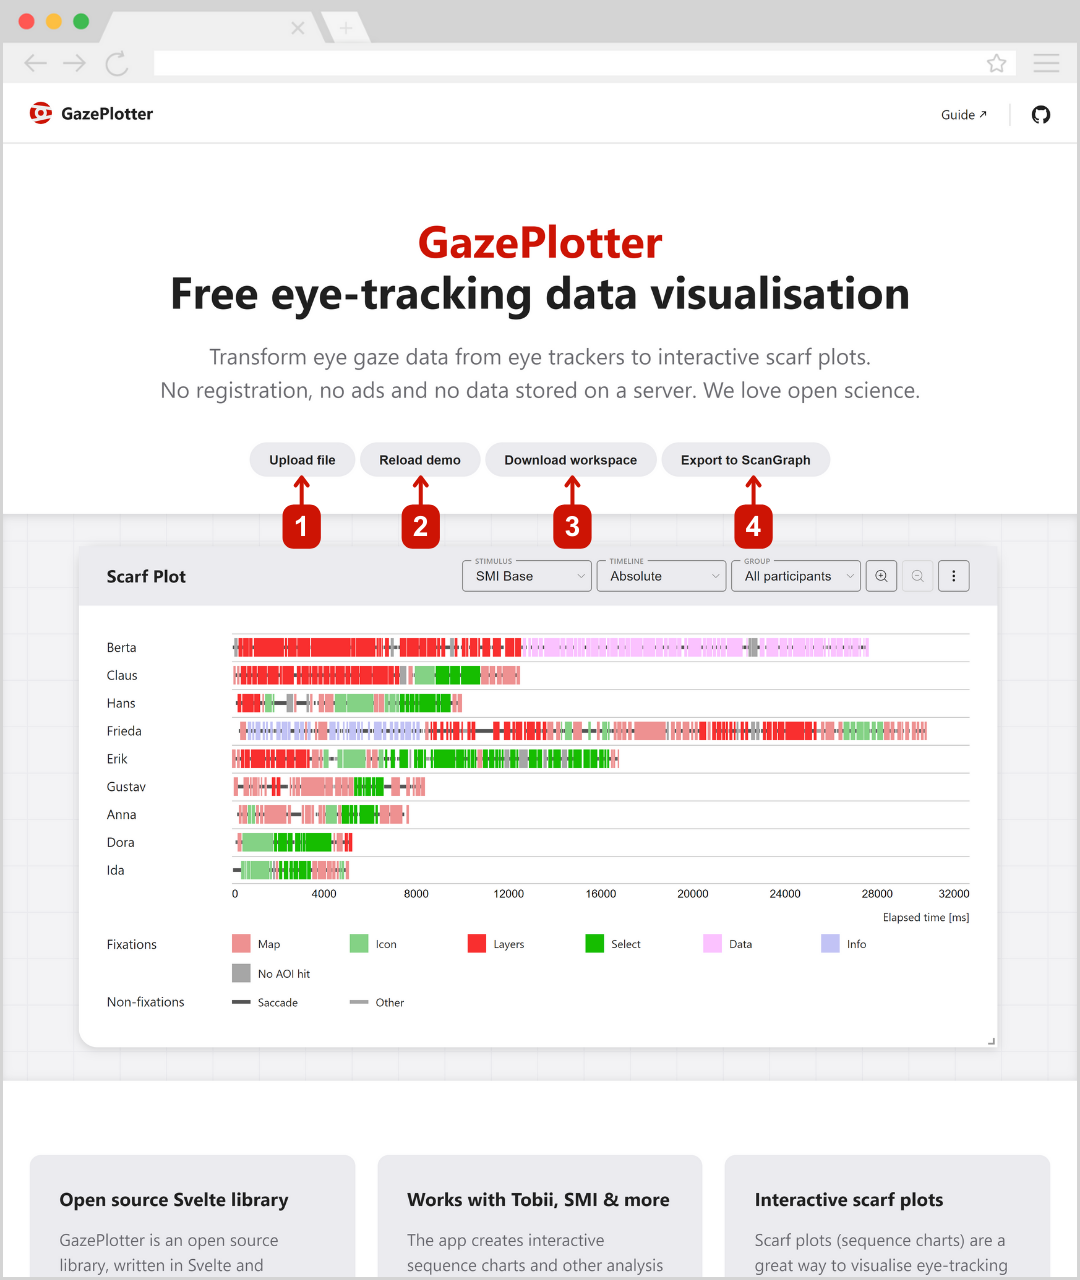
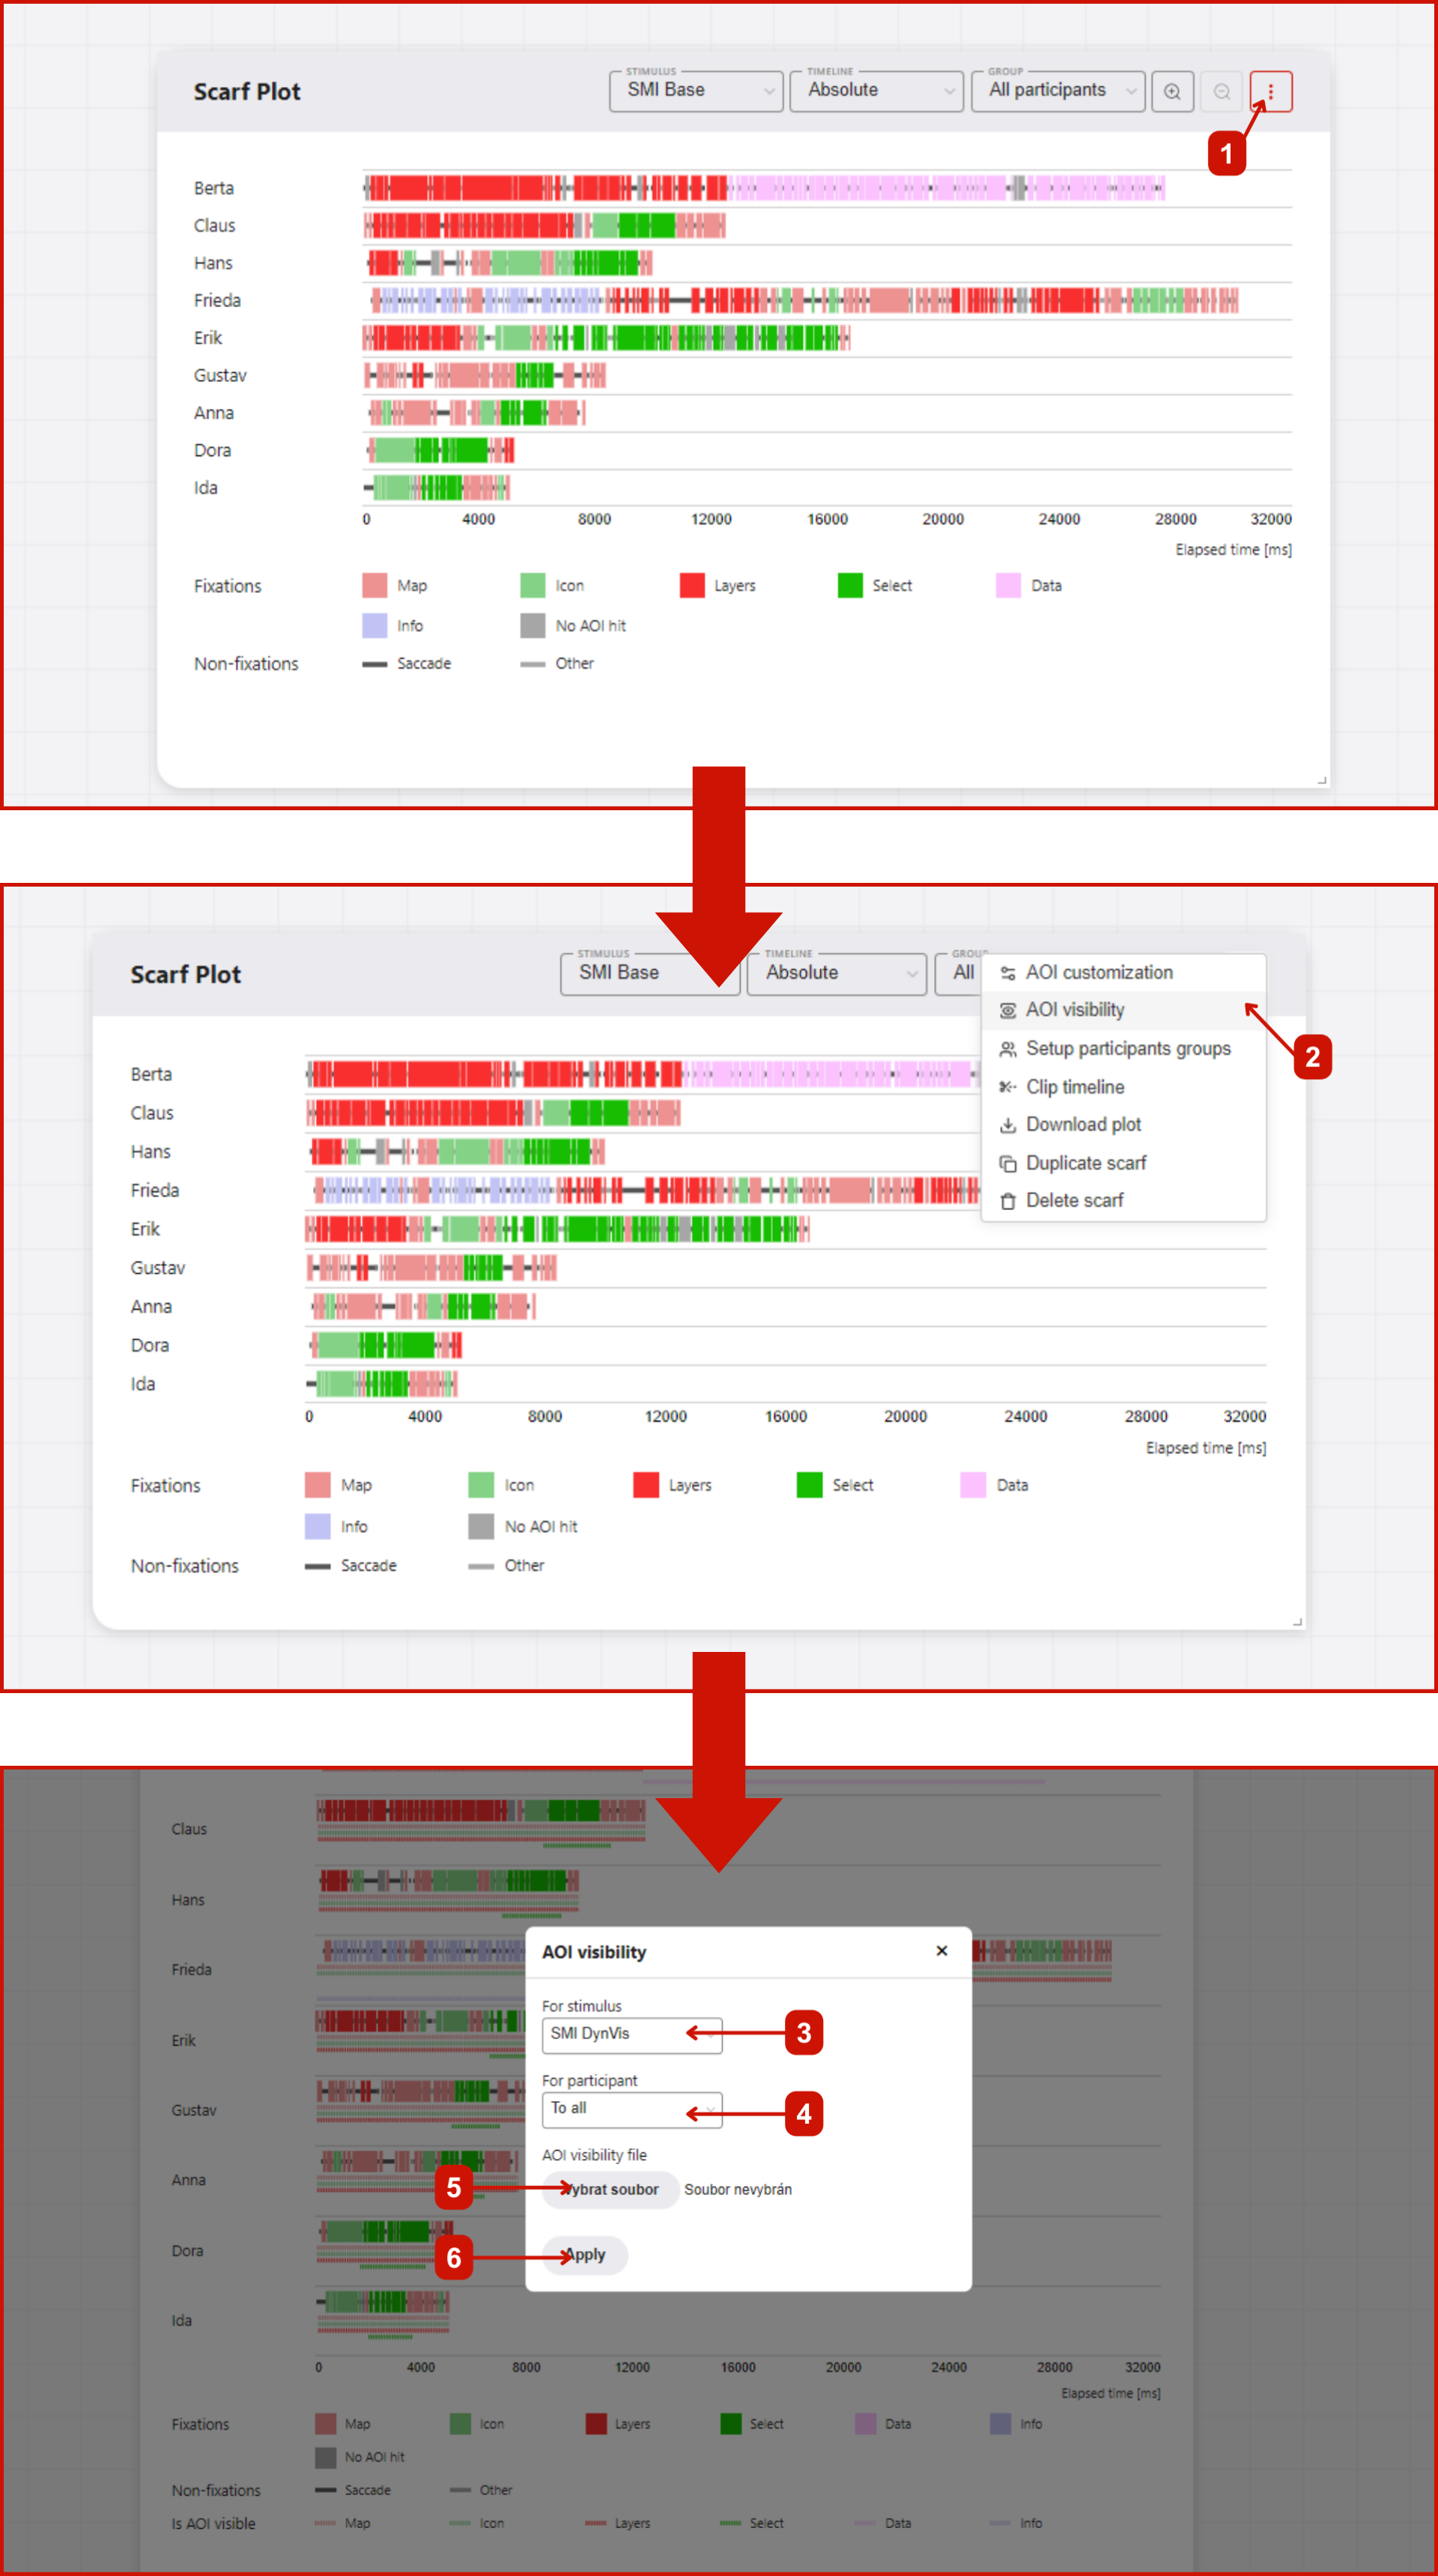
As seen on Figure 1, adding AOI visibility data to the workspace have following steps:
- Click
More optionsbutton in the top right corner of the scarf plot with desired stimulus set. - In the pop-up menu, select
Add AOI visibility data. - In new window, select the
.xmlfile with AOI visibility data (either from SMI BeGaze or Tobii Pro Lab). - Select whether to add the AOI visibility data to all participants or only to the selected one.
- Click
Applybutton. The AOI visibility data will be added to the workspace.
Interactivity of AOI visibility data
Each AOI visibility data is represented by a colored line. This is expanded and thus highlighted when the mouse is moved over the corresponding AOI category in the legend.