Workspace
The workspace is your main analysis area in GazePlotter. Think of it as your primary dashboard where you can simultaneously view multiple visualizations, juxtapose different data sets, and create custom layouts that precisely fit your analytical workflow.
Initial Layout
When you first upload your eye-tracking data, GazePlotter jump-starts your analysis by rendering a default set of visualizations.
Automatically Generated Plots
Four distinct visualizations are created immediately upon data upload.
- Scarf Plot: Visualizes gaze sequences and temporal behavior.
- Bar Plot: Provides highly structured statistical analysis metrics.
- Transition Matrix: Shows heat map views of gaze movement between Areas of Interest.
- Time-binned AOI Occupancy: Displays a flowing representation of attention distribution over time.
Workspace Toolbar
Locked to the left side of your screen is the vertical workspace toolbar. This toolbar provides immediate access to global layout commands and metadata.
Layout Management
- Undo / Redo: Step backward or forward through any changes made to the workspace layout or internal plot configurations.
- Reset Layout: Instantly reorganize all currently visible plots back into a clean, systematic grid layout.
Adding Visualizations
- Add Visualization: Opens a menu to instantiate a brand new Scarf Plot, Bar Plot, Transition Matrix, or Time-binned AOI Occupancy plot. New plots are appended to the nearest empty space in the grid layout.
General Information
- Source Metadata: View detailed technical information about your processed data, original format, and system usage. See the Source Metadata documentation for more details.
Plot Manipulation
Every individual visualization plot functions as an independent, interactive card. They can be freely manipulated using the drag-and-drop interface.
(For changing exactly what data is displayed inside the plot itself, consult the documentation for your specific plot type, e.g., Scarf plot options).
Spatial Arrangement
Moving a plot
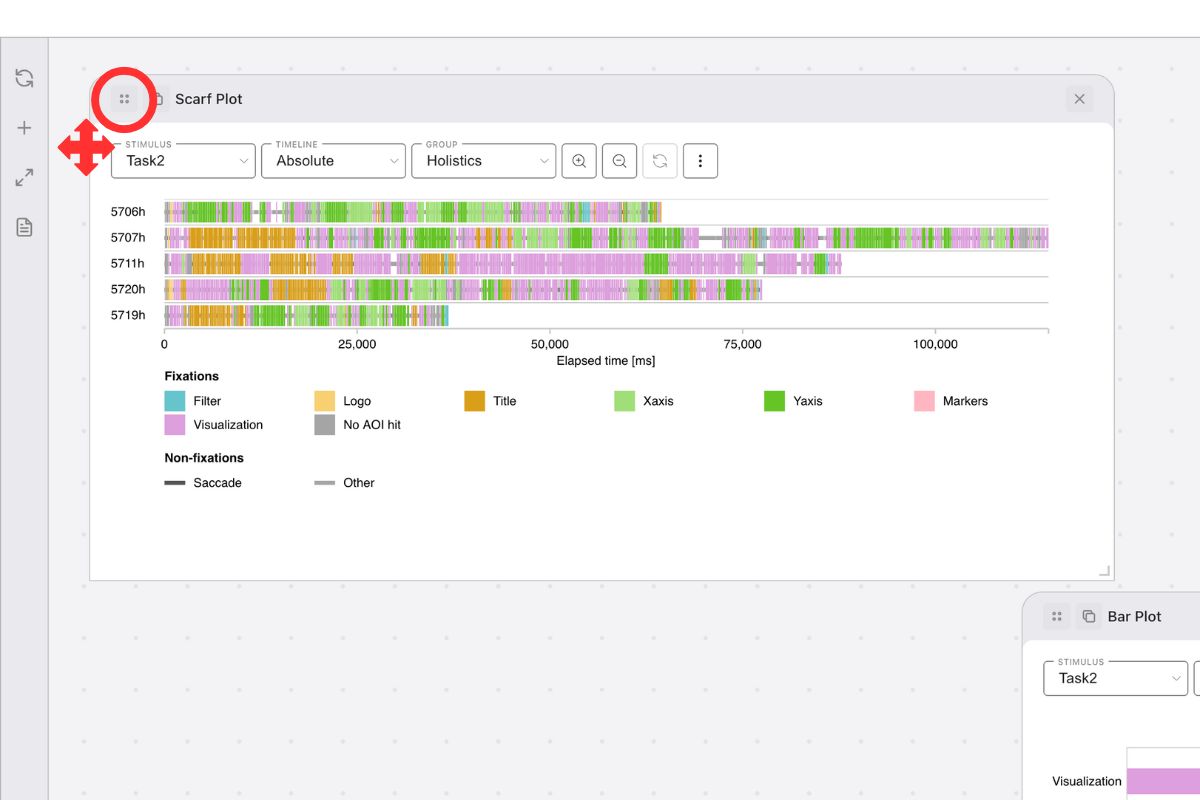
- Action: Click and drag the drag handle (the 4-dots group icon in the plot’s top header).
- Behavior: Plots snap cleanly to an underlying 50x50 pixel grid. The workspace canvas boundary automatically expands if a plot is dragged to the edges.
Resizing a plot
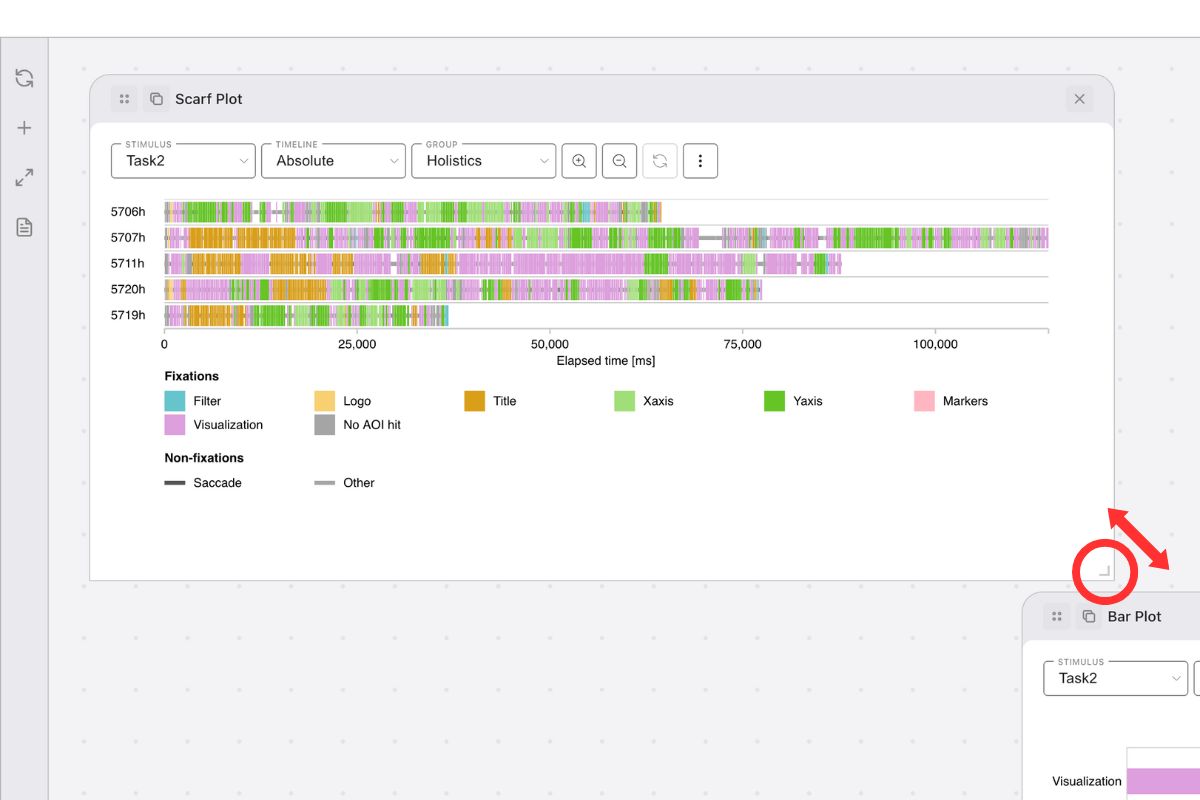
- Action: Click and drag the bottom-right corner of the plot card.
- Behavior: The plot bounding box maintains proportional sizing while snapping to the underlying grid configuration.
Object Management
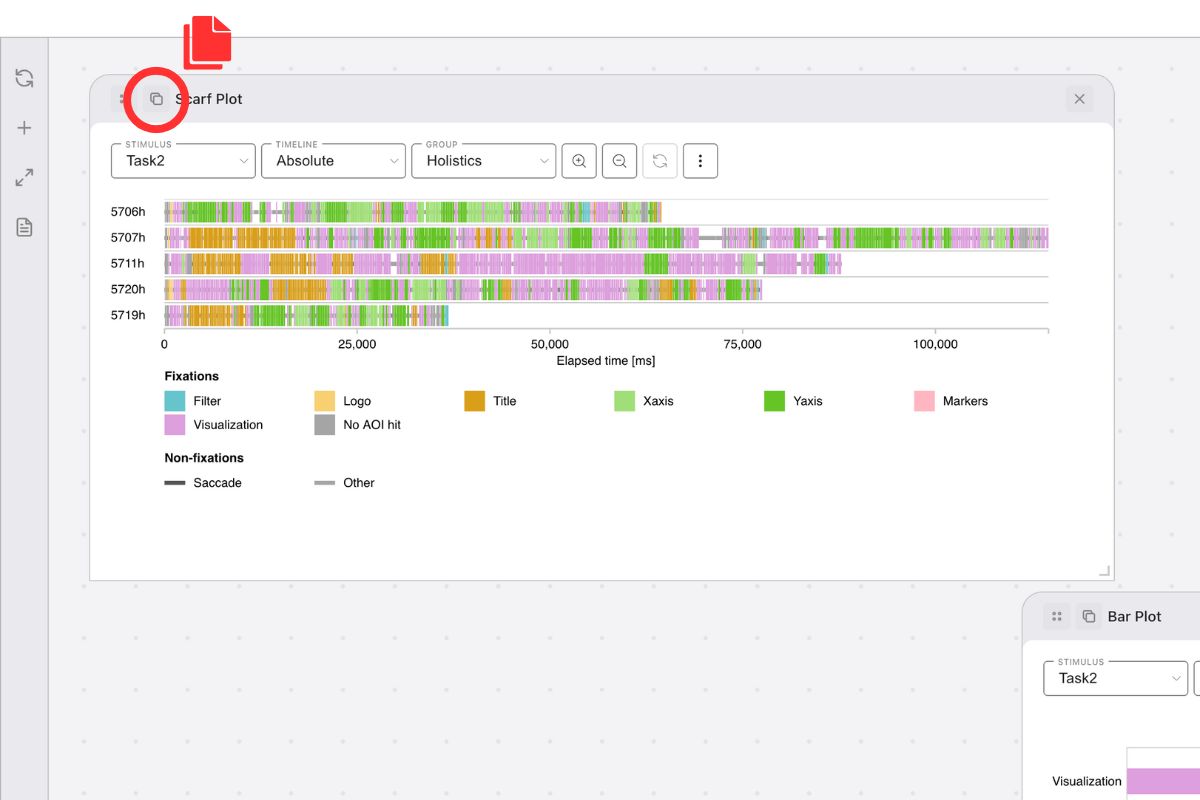
Duplicating a plot
- Action: Click the Duplicate button (the copy icon in the plot’s top-left header).
- Behavior: Creates an identical copy of the plot in the workspace. It faithfully copies all current settings, including applied participant groups, stimulus selections, axis bounds, and custom color palettes.
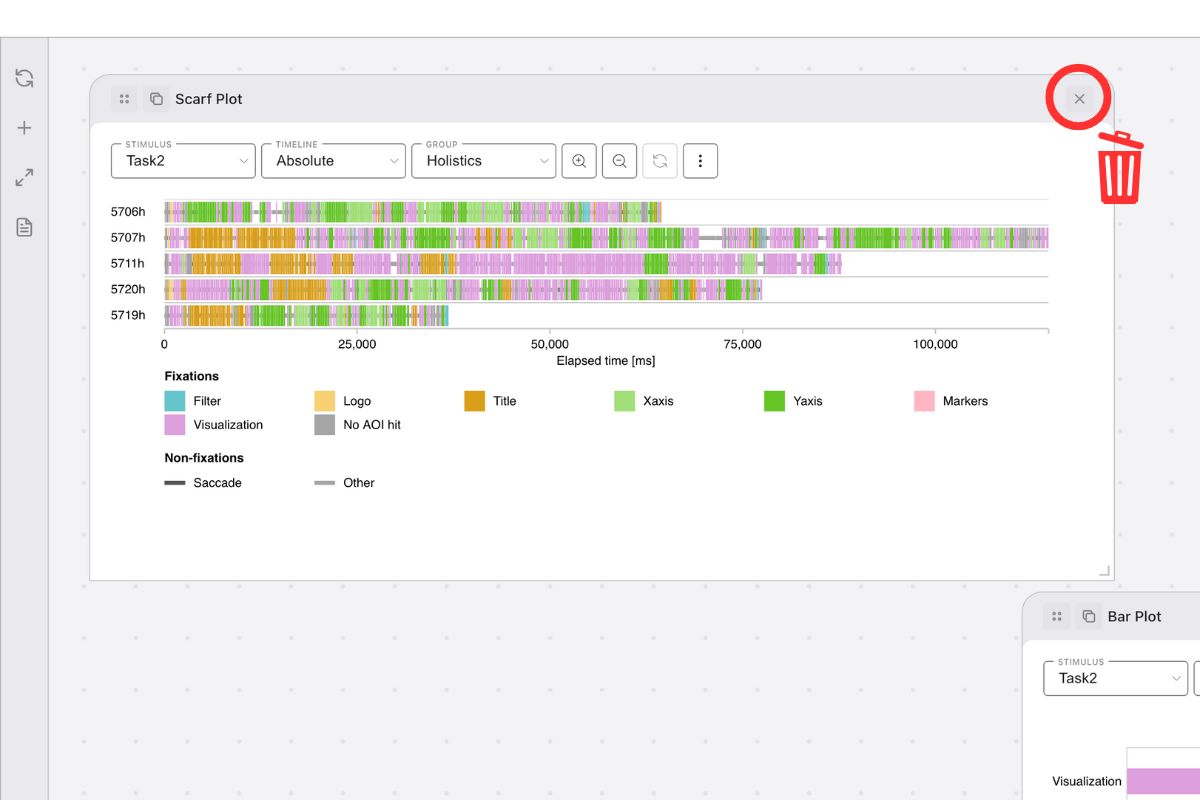
Removing a plot
- Action: Click the Remove button (the X icon in the plot’s top-right header).
- Behavior: The plot is permanently deleted from the workspace viewport.
State Preservation
Rather than saving your visual settings manually, you can reliably capture and restore your entire analysis setup.
Workspace Export
The Workspace Export tool serializes your entire workspace layout and state into a standalone JSON file.
Exporting preserves the complete state of your analysis:
- Spatial Grid Layout: Exact plot positions and pixel dimensions.
- Internal Plot Settings: Every toggle, bound, and data view setting configured.
- Global Customizations: Modifications like Participant Groupings, named AOIs, and Data Filtering configurations.
Workspace Management Use Cases: Use the workspace export function frequently to save progress checkpoints. These highly compressed JSON files are perfectly suited for:
- Collaboration: Email complete, ready-to-view dashboards to your research team.
- Templates: Create standardized bounding layouts for similar analysis projects.
- Version Control: Keep a history log of different iterative visualization approaches.