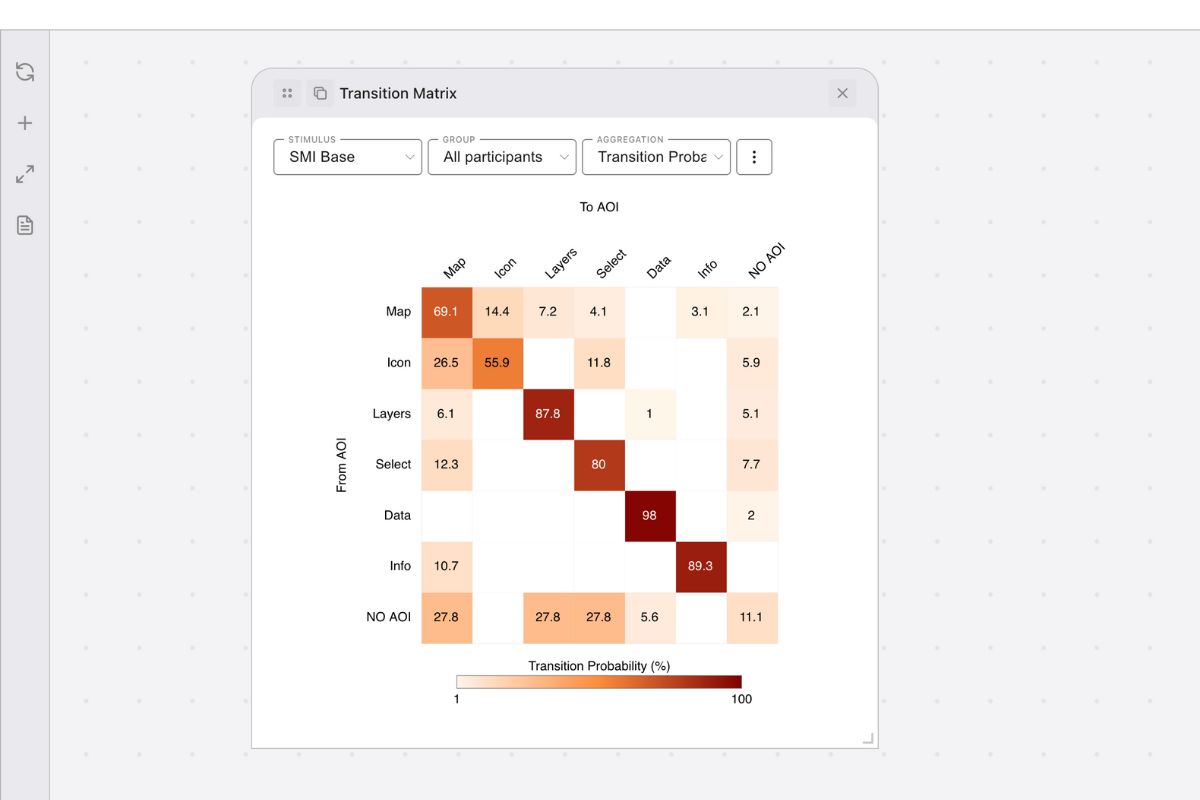
Transition Matrix
Transition Matrix in GazePlotter provides a visual analysis of gaze transition patterns between Areas of Interest (AOIs). This heat map visualization shows how participants’ gaze moves from one AOI to another, revealing scanpath patterns and visual attention flow in eye-tracking research.
Interested on how to operate with plots in general within the workspace? See:
Overview
The Transition Matrix displays a square matrix where rows represent the “FROM” AOI (where gaze started), columns represent the “TO” AOI (where gaze moved) and cell values show the strength of transitions using color intensity.
Basic Controls
In GazePlotter, transition matrices have the following main controls:
- Stimulus - a drop-down menu for selecting the stimulus to be analyzed.
- Group - a drop-down menu for selecting the participant group.
- View - a drop-down menu for selecting the data representation or aggregation method.
- More options (⋮) - a button for accessing additional customization and export options.
Stimulus
Choose which stimulus to analyze. Each stimulus contains its own set of AOIs that will be displayed in the matrix.
Group
Select participant groups:
- All participants - includes data from all participants
- Custom groups - analyze specific participant groups created in the grouping interface. See Participant Groups.
View
The View dropdown determines what metric is calculated and displayed. Clicking on a view option opens a settings dialog with customizable parameters for the plot.
Absolute frequency
Raw number of transitions between AOI pairs summed across all participants.
| Parameter | Description |
|---|---|
| Scale Range | Customize the value axis minimum and maximum for color intensity (0 = Auto) |
| Colors | Select the minimum, middle, and maximum colors for the transition matrix gradient |
Relative frequency
Percentage of all transitions that occur between each AOI pair.
| Parameter | Description |
|---|---|
| Scale Range | Customize the value axis minimum and maximum for color intensity (0 = Auto) |
| Colors | Select the minimum, middle, and maximum colors for the transition matrix gradient |
1-step probability
Conditional probability of transitioning TO each AOI given you’re coming FROM a specific AOI.
| Parameter | Description |
|---|---|
| Scale Range | Customize the value axis minimum and maximum for color intensity (0 = Auto) |
| Colors | Select the minimum, middle, and maximum colors for the transition matrix gradient |
2-step probability
Probability of reaching each AOI after exactly 2 transitions (via one intermediate AOI).
| Parameter | Description |
|---|---|
| Scale Range | Customize the value axis minimum and maximum for color intensity (0 = Auto) |
| Colors | Select the minimum, middle, and maximum colors for the transition matrix gradient |
3-step probability
Probability of reaching each AOI after exactly 3 transitions (via two intermediate AOIs).
| Parameter | Description |
|---|---|
| Scale Range | Customize the value axis minimum and maximum for color intensity (0 = Auto) |
| Colors | Select the minimum, middle, and maximum colors for the transition matrix gradient |
Fixation duration
Average duration of individual fixations in the “FROM” AOI before making a transition.
| Parameter | Description |
|---|---|
| Scale Range | Customize the value axis minimum and maximum for color intensity (0 = Auto) |
| Colors | Select the minimum, middle, and maximum colors for the transition matrix gradient |
Dwell duration
Average total duration of consecutive fixations on the same AOI before transitioning to a different AOI.
| Parameter | Description |
|---|---|
| Scale Range | Customize the value axis minimum and maximum for color intensity (0 = Auto) |
| Colors | Select the minimum, middle, and maximum colors for the transition matrix gradient |
More options
The transition matrix menu (⋮) provides quick access to:
Customization Options
- Stimulus customization - Manage stimulus properties and settings. See Stimuli Customization for details.
Download plot
Export individual transition matrices as image files:
- File formats: PNG (recommended, transparent background) or JPG (white background)
- Dimensions: Customizable width (height maintained as square for proper matrix proportions)
- Quality: Adjustable DPI setting for screen (96 DPI) or print (300 DPI) use
- Margins: Configurable top, right, bottom, left margins
- Preview: Live preview of your exported plot before downloading
Interpretation
Use Transition Matrix in your eye-tracking analysis to:
- Identify scanpath patterns - discover common gaze movement sequences
- Compare transition frequencies - see which AOI pairs attract the most transitions
- Analyze attention flow - understand how gaze moves through your stimulus
- Detect visual hierarchies - identify which AOIs serve as “hubs” for attention
- Group comparisons - analyze how different participant groups navigate your stimulus
Reading the Matrix
- Diagonal values - transitions within the same AOI (re-fixations)
- High-value cells - common transition paths in your stimulus
- Row patterns - where gaze typically goes FROM each AOI
- Column patterns - where gaze typically comes TO each AOI
- Empty cells - transitions that rarely or never occur
Matrix Interpretation: Dark cells indicate strong transition patterns. Look for:
- Hot spots - frequently used gaze paths
- Cold spots - avoided transitions
- Row/column dominance - AOIs that attract or distribute attention